The peace dividend many of us were born into has expired.
We’re entering a new geopolitical reality—one where defense investment can no longer be ignored, even in the most ethically constrained portfolios. Whether you’re in a public pension, a family office, or a university endowment, the relevance of defense—both from a return and a risk management perspective—is rising fast. The question is no longer if you should think about defense exposure, but how you approach it.
Context: A New Strategic Normal
In my early days working at a pension fund, defense exposure was marginal—both in scale and scrutiny. But at Axxets today, that conversation is shifting.
The war in Ukraine, tensions in the South China Sea, and increasing cyber threats have created a multipolar environment with fragmented alliances and local conflicts. These aren’t isolated skirmishes—they represent a structural shift. Defense spending is no longer cyclical; it’s foundational.
This shift is being echoed across markets:
- Anduril in the U.S. is pushing forward dual-use defense tech that sits at the edge of AI and autonomy.
- Rheinmetall is playing a growing role as Europe seeks defense sovereignty.
- Turkey’s defense industry has become a powerhouse in drone and missile development.
- Even Nigeria is stepping up as ECOWAS’s security guarantor—something unthinkable a decade ago.
This isn’t just about legacy players like Lockheed or Raytheon anymore. The industry is evolving—and fast.
Insight #1: Defense as Strategic Infrastructure
One lesson we’ve learned is that defense is increasingly analogous to energy or cybersecurity—a non-optional sector underpinning state functionality. For many regions, it’s also an employment engine and a source of technology spillovers.
While traditional defense primes are still important, we’re seeing compelling innovation at the intersection of software, AI, and autonomy. These startups—and the venture capital flowing into them—are modernizing the defense sector with scalable, modular solutions that can support both military and civilian uses.
For allocators, this means the entry points are no longer limited to defense ETFs or legacy primes. Private capital is playing an increasingly important role in shaping the industry’s next chapter.
Insight #2: Valuations and Volatility Are Real
The reality is more nuanced than “defense is back.” High valuations—often pushing P/E ratios near 40x—aren’t uncommon. Much like in AI, investors must be selective and realistic about what’s already priced in.
Add to that policy risk and export restrictions, and you’ve got a highly reactive asset class. For example, a shift in U.S. foreign policy can cancel contracts overnight.
In practice, this means we focus on:
- Dual-use technologies with civilian applications.
- Localized players with government backing and cost advantages.
- Suppliers in NATO-adjacent markets adapting to new procurement frameworks.
Being thoughtful here isn’t just ethical—it’s also practical portfolio construction.
Insight #3: Ethics, Exposure, and the Investment Dilemma
At Axxets, we’ve had internal debates on how to incorporate defense. It’s a conversation that balances fiduciary responsibility with family values.
Defense investing isn’t binary.
It can include supply chain tech, cybersecurity, drone navigation, AI systems, and encrypted communication platforms—each sitting on a spectrum from commercial to military use.
That said, not investing in the sector is also a choice—with its own trade-offs. Ignoring the conversation entirely risks missing exposure to a sector reshaping global power dynamics and, by extension, markets.
Final Thought: Don’t Skip the Conversation
Defense is no longer a niche or optional allocation. Whether your conclusion is to invest or to consciously exclude it on ethical grounds, the conversation must be had.
Because in a world where geopolitics directly shapes returns, sitting on the sidelines is itself a decision—one that should be made thoughtfully, not passively.
What role does defense play in your portfolio today? Is it time to revisit that assumption?
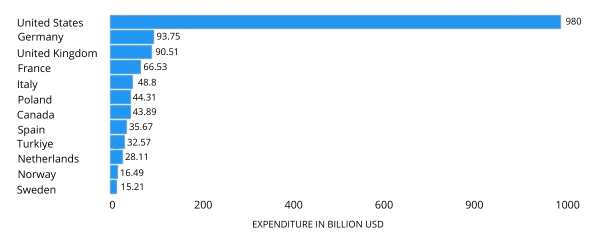
Source: STATISTA