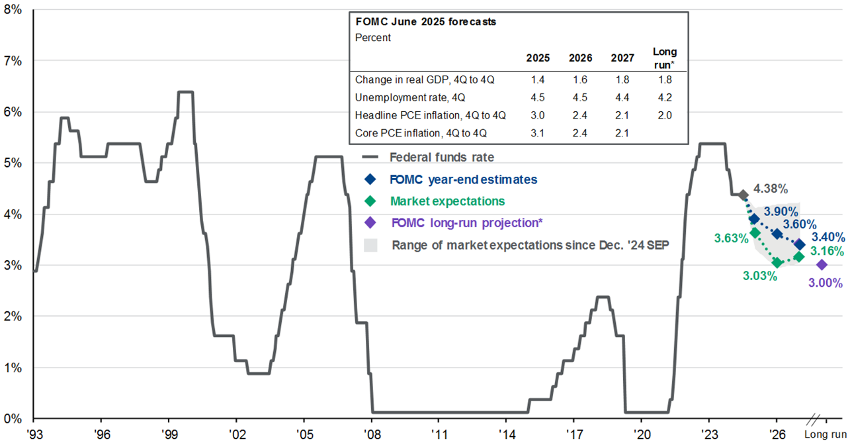
The Federal Reserve lowered its benchmark rate to a 4.00%–4.25% range, in line with expectations. The decision was nearly unanimous, with only one dissent. Projections point to two additional cuts before year-end, which would bring the average rate to 3.6%.
For 2026, the Fed anticipates just one more adjustment. While inflation and unemployment forecasts remained unchanged, Jerome Powell acknowledged a substantial slowdown in labor demand and job creation.
The Fed confirms a policy shift but with caution. The bias remains restrictive: only three cuts are projected through 2026. Markets will closely monitor upcoming inflation and employment data.
FED Indicators Update (September vs. June)
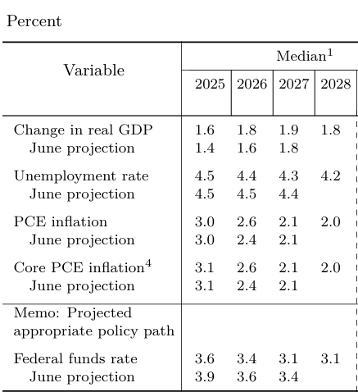
Source: Federal Reserve.